The Analyse Engine: Turning Data into Direction
You stop creating content based on hunches and start creating based on evidence. You stop optimizing random variables and start optimizing what actually moves the needle. You stop wondering why performance fluctuates and start understanding the underlying mechanics.


Your monitoring dashboard lights up. Traffic is down 23% on your latest campaign. Email open rates have dropped. Social engagement is trending downward.
You know what happened. But do you know why? More importantly, do you know what to do about it?
This is where most digital content strategies break down. They measure everything but understand nothing. They're drowning in data while starving for insight.
The Strategic Brain of Your Flywheel
Think of your content flywheel as a living system. The Monitoring Engine is its nervous system, detecting signals throughout your content ecosystem. But without a brain to interpret those signals and make decisions, you're just collecting symptoms without diagnosing the disease.
The Analyse Engine is that strategic brain. It transforms raw performance data into actionable intelligence. It connects the dots between audience behavior, content performance, and business outcomes. It tells you not just what happened, but why it happened and what you should do next.
Escaping the Insight Gap
Most businesses suffer from what I call "Data Rich, Insight Poor" syndrome. They have dashboards full of colorful charts. They track dozens of metrics. They can tell you their bounce rate down to the decimal point.
But when you ask them why their content isn't converting, or which topic clusters actually drive pipeline, or what content to create next month, they freeze. The numbers are there, but the meaning isn't.
This is the Insight Gap, and it's costing you momentum. Every day you spend reacting to symptoms instead of addressing root causes is a day your competitors are optimizing their way past you.
The Analytics Evolution: From Hindsight to Foresight
The Analyse Engine moves you through three critical stages of analytical maturity. To master each stage, you need the right tools.
1. Descriptive Analytics: What happened?
This is where most teams live. You ran a campaign, and here are the numbers. Traffic went up. Conversions went down. This is useful for reporting, but it's fundamentally backward-looking.
2. Diagnostic Analytics: Why did it happen?
This is where insight begins. Traffic went up because you ranked for a new keyword, but conversions went down because the traffic was top-of-funnel.
- AI Tool for Content Performance: ChatGPT or Claude.
- How to use it: Export your top 10 and bottom 10 posts. Feed them into the AI and ask: "Analyze the patterns in tone, structure, and topic between my best and worst performing content. Give me 3 rules for my next post."
- AI Tool for Audience Sentiment: Akkio or MonkeyLearn.
- How to use it: These no-code AI tools can analyze thousands of customer comments, reviews, and support tickets to detect sentiment trends (Positive/Negative) and extract key topics automatically.
3. Prescriptive Analytics: What should we do next?
This is strategic gold. Based on keyword performance and user intent analysis, double down on educational content for this segment.
- AI Tool for ROI & Strategy: Polymer.
- How to use it: Polymer uses AI to turn messy spreadsheets (like your exported leads and sales data) into interactive, searchable databases. It helps you find correlations between content consumption and purchase behavior without needing a data scientist.
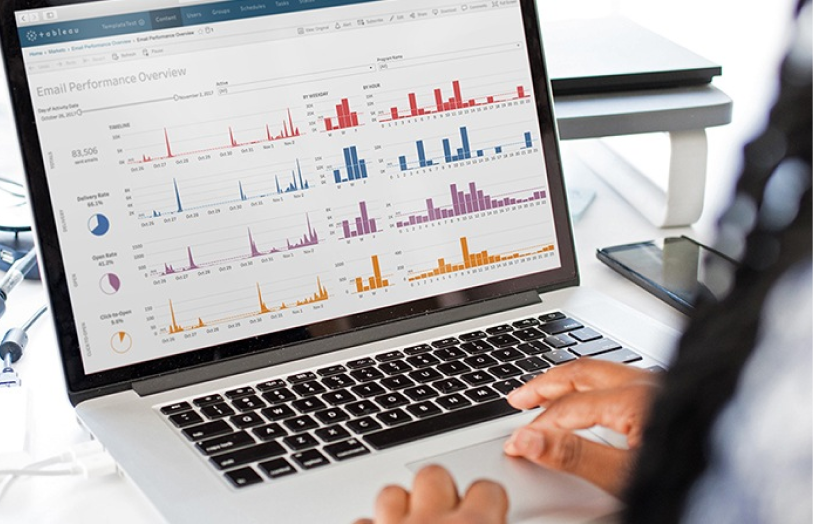
Visualizing the Truth with Tableau
To truly bridge the gap between data and insight, you need tools that allow you to see the story your data is telling. This is where Tableau becomes essential.
Tableau is not just a reporting tool; it is an exploration engine. It allows you to blend data from your website, CRM, and social platforms into a single, interactive "Source of Truth."
The "Aha!" Moment
Visualizing data isn't just about making pretty charts; it's about cognition. When you see a trend line dip at the exact moment you stopped posting on Instagram, the connection becomes undeniable.
"Tableau was the catalyst in helping employees have that ‘aha data moment’. That flicker of data cognition turning into deeper understanding was what Nissan needed for success in a digital world."
— Danielle Beringer, Regional Data Officer, Nissan North America
Why Tableau for Entrepreneurs?
- Unified View: Stop logging into 10 different tools. See your entire flywheel in one dashboard.
- Interactive Exploration: Don't just look at a static report. Click on "Mobile Users" and watch the whole dashboard update to show you their specific journey.
- Storytelling: Use data to tell a story to your team, your investors, or yourself.
What Analysis Actually Looks Like in Practice
Real analysis isn't about staring at Google Analytics until patterns emerge through sheer willpower. It's a systematic process of asking better questions and connecting multiple data sources.
Here's what that looks like:
Pattern Recognition Across Time
You notice that blog posts published on Tuesday consistently outperform the same topics published on Thursday. But it's not just about the day. When you dig deeper, you discover Tuesday posts get included in a popular industry newsletter that sends on Wednesday.
- Insight: Coordinate your publishing schedule with external distribution opportunities.
Cross-Channel Correlation
Your LinkedIn posts about a specific pain point generate massive engagement, but your blog posts on the same topic get modest traffic. Analysis reveals that your LinkedIn audience is different from your blog audience, or that LinkedIn's format suits the topic better.
- Decision: Create LinkedIn-native content for this theme instead of trying to force blog traffic.
Behavioural Segmentation
You segment your audience by behaviour and discover that people who read three or more articles on Topic A are 5x more likely to convert than those who read broadly across topics.
- Insight: Create content clusters and internal linking strategies that encourage depth over breadth for high-intent topics.
Attribution Mapping
You track the actual customer journey and find that your top-performing "conversion" content is almost never the first piece someone reads. Your real revenue driver is a deep-dive guide that most people find after reading two or three other pieces.
- Decision: Build content paths that lead to this guide rather than promoting it directly.
This is analysis. It's detective work. It's connecting cause and effect across your entire content ecosystem.
Building Your Analyse Engine
Creating an effective analysis capability requires three elements:
- The Right Questions. Most teams analyze what's easy to measure rather than what matters. Start with business questions: What content actually drives qualified leads? Which topics build authority that leads to sales conversations? What content keeps customers engaged post-purchase? Then work backward to find the data that answers those questions.
- Connected Data. Your analytics tools are probably siloed. Website analytics don't talk to your email platform. Social metrics live in their own universe. CRM data is disconnected from content performance. The Analyse Engine requires you to bridge these gaps, even if it means manual correlation at first.
- Regular Rhythm. Analysis can't be something you do when you remember or when the quarterly review rolls around. Build it into your weekly and monthly rhythm. Set aside time to look at patterns, test hypotheses, and extract insights. Make it a discipline, not an afterthought.
From Reactive to Proactive
Here's what changes when you have a functioning Analyse Engine:
You stop creating content based on hunches and start creating based on evidence. You stop optimizing random variables and start optimizing what actually moves the needle. You stop wondering why performance fluctuates and start understanding the underlying mechanics.
Most importantly, you shift from reactive to proactive. Instead of scrambling to figure out why last month was bad, you're identifying opportunities before they fully materialize. You're spotting trends in your data that let you adjust course before problems become crises.
Your content flywheel doesn't just spin. It learns. It gets smarter with every revolution because you're feeding insights back into every other engine.
The Compound Effect of Understanding
The real power of the Analyse Engine reveals itself over time. Each insight builds on previous insights. Each analysis refines your understanding of what works and why.
After six months of consistent analysis, you're not just seeing what happened in isolation. You're seeing seasonal patterns, audience evolution, competitive shifts, and the long-term impact of strategic decisions.
After a year, you have a dataset and understanding that would be nearly impossible for a competitor to replicate. You know your audience better. You understand your content's true performance drivers. You can predict outcomes with increasing accuracy.
This is the compound effect of understanding. And it's only possible when you build analysis into the foundation of your content system.
The Missing Piece
Most content operations have monitoring. Many have decent content production. Some even have good distribution.
But very few have true analysis. They're flying blind at 500 miles per hour, making course corrections based on gut feel and incomplete information.
The Analyse Engine is how you see clearly. It's how you transform the chaos of digital marketing into a system you can understand, predict, and optimize.
It's not the flashiest part of your content flywheel. But it might be the most important.
Get in the loop
The output of the Analyse phase of course becomes the input for the Create Phase, and so it goes round.
View the interactive page here & download the workbook