Closing the Loop on Content Performance
"What gets measured gets managed. What gets managed gets improved."

by Jim James
Most entrepreneurs fly blind. They publish content, send emails, and run ads, but they have no idea what is actually working. This includes me too by the way, hence writing this article to remind myself of best practice.
"What gets measured gets managed. What gets managed gets improved."
In effect we're driving a sports car at 100mph with the windshield painted black.
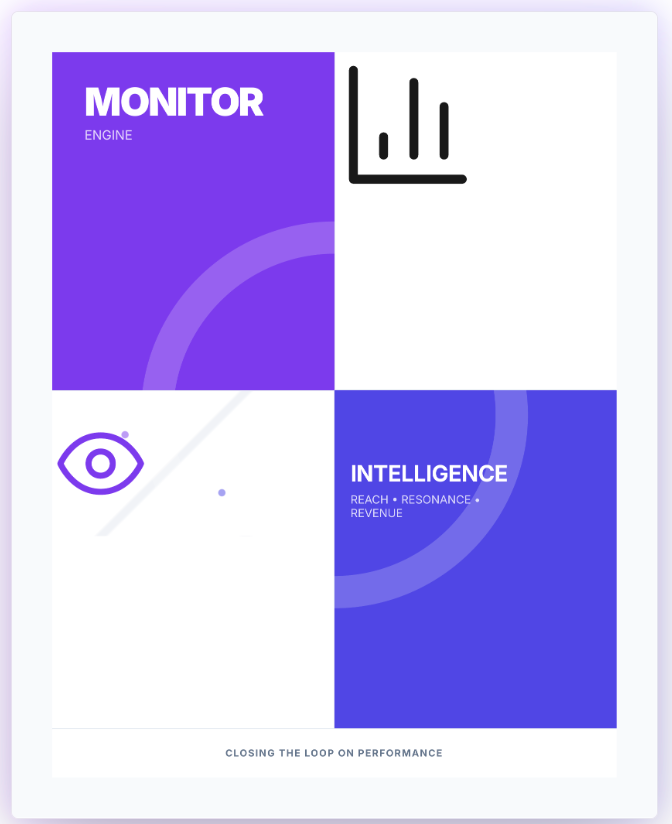
The Monitor Engine is your dashboard. It is the difference between "guessing" and "knowing."
If Creation is the fuel, Publishing is the engine, and Promotion is the accelerator, then Monitoring is the GPS. Without it, you are moving fast, but you are likely going in circles.
The Vanity Trap
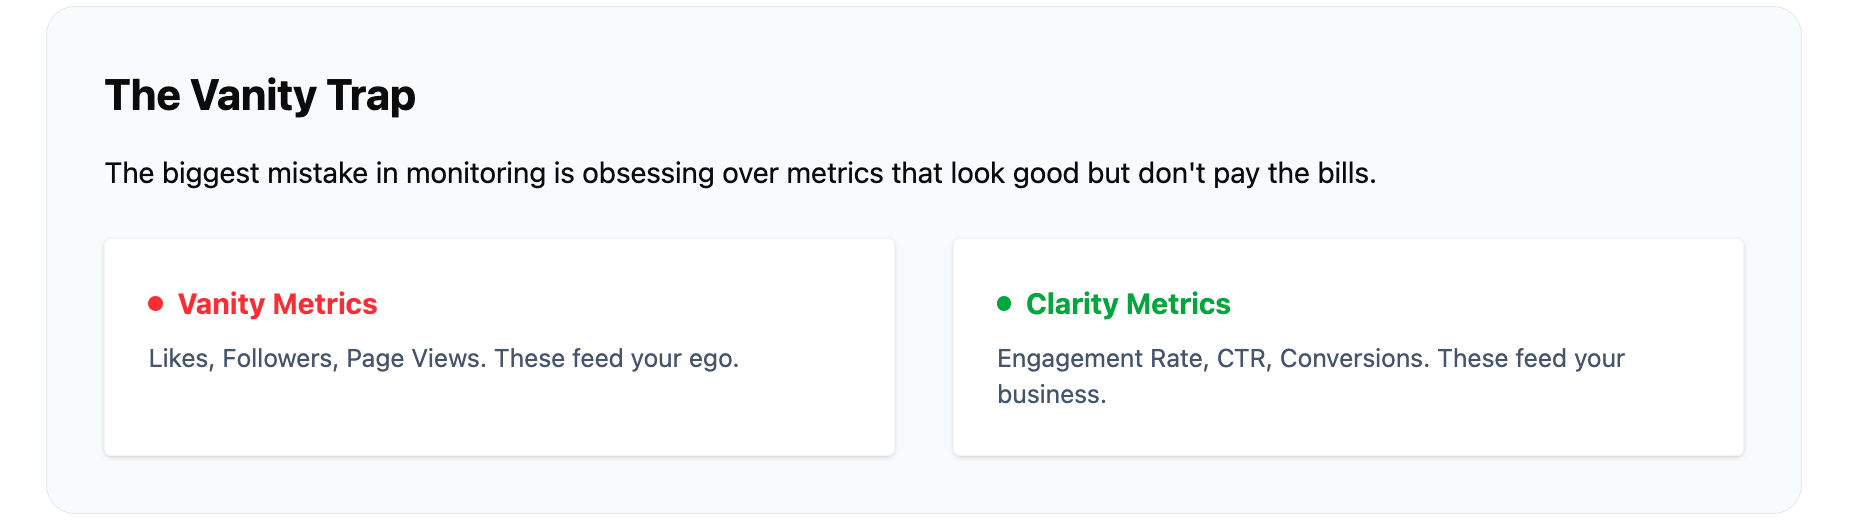
The biggest mistake in monitoring is obsessing over "Vanity Metrics."
- Vanity Metrics: Likes, Followers, Page Views. These make you feel good (ego), but they don't pay the bills.
- Clarity Metrics: Engagement Rate, Click-Through Rate (CTR), Conversion Rate, Sentiment. These tell you if your message is actually landing.
You can have 100,000 followers and zero sales. You can have 1,000 followers and a million-dollar business. The difference is in what you measure.
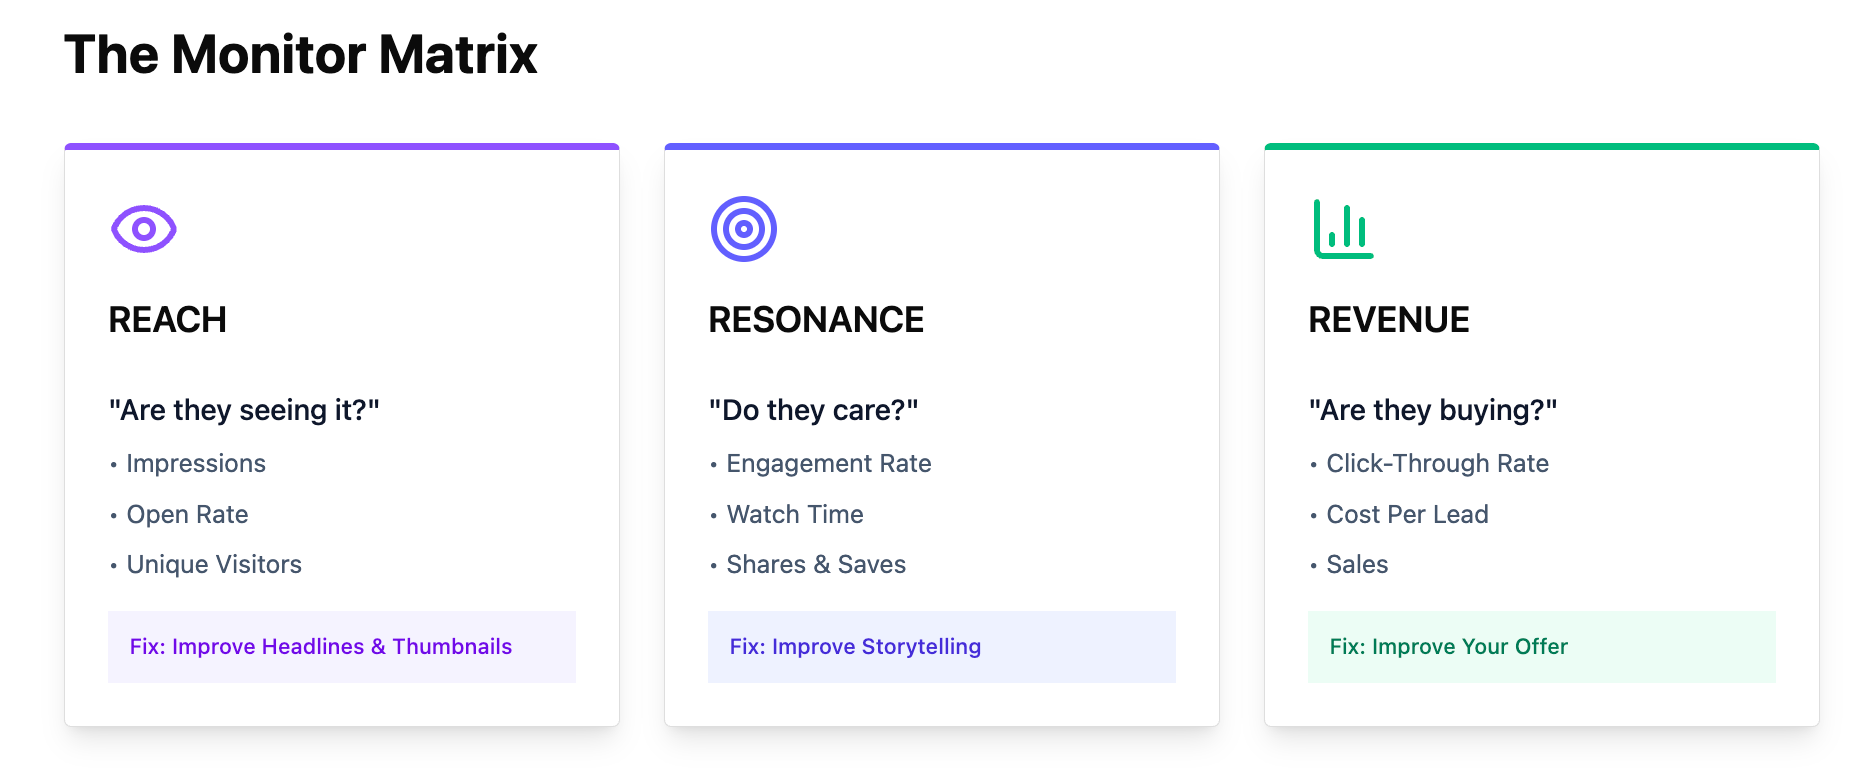
The Monitor Matrix: What to Measure
To build a healthy feedback loop, you need to track three distinct layers of data. Each layer answers a different question about your business health.
The "Listen, Learn, Pivot" Framework
Monitoring is not a passive activity. It is an active cycle of improvement. You don't just watch the numbers; you react to them.
1. Listen (The Qualitative Layer)
Data tells you what happened. Listening tells you why.
- Comments Section: This is a goldmine. What questions are people asking? What are they arguing about?
- Sales Calls: What objections do prospects raise? What words do they use to describe their pain?
- Social Listening: Use tools to track mentions of your brand or keywords in your industry.
2. Learn (The Insight Layer)
Turn data into hypotheses.
- Observation: "My posts about 'Team Culture' get 3x more shares than my posts about 'Product Features'."
- Insight: "My audience cares more about leadership than technical specs."
3. Pivot (The Action Layer)
Change your behavior based on the insight.
- Action: "I will shift my content calendar to be 70% Leadership / 30% Product."
Advanced Monitoring Layers
For businesses ready to scale, basic analytics aren't enough. You need to see the entire landscape.
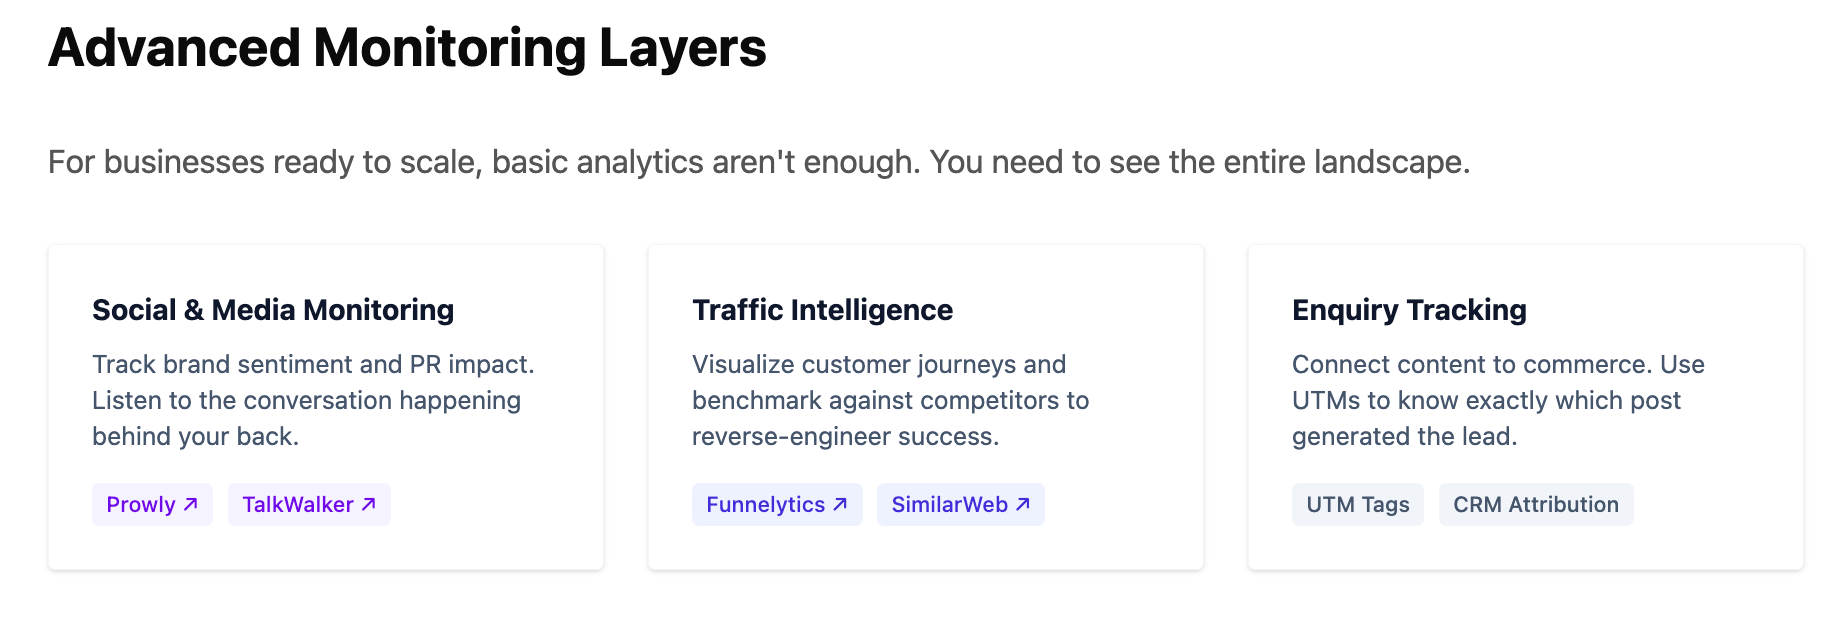
1. Social Media & Media Monitoring (Brand Sentiment)
It's not just about what you say; it's about what others say about you. You need to listen to the conversation happening behind your back.
- The Goal: Track brand mentions, sentiment, and PR impact across the web and social platforms.
- Tools:
- Prowly: Excellent for managing PR workflows and tracking media coverage.
- TalkWalker: A powerful social listening tool that analyzes sentiment (positive/negative) across millions of sources.
2. Traffic Intelligence (Source & Journey)
Google Analytics tells you how many people visited. Traffic intelligence tells you where they came from and how they behaved.
- The Goal: Visualize the customer journey and benchmark against competitors.
- Tools:
- Funnelytics: Maps out the visual path your customers take (e.g., Ad -> Blog -> Webinar -> Sale), showing you exactly where they drop off.
- nb. you can watch the founder of Funnelytics explain how this all works to me on The UnNoticed Entrepreneur podcast.
- SimilarWeb: Provides competitive intelligence. See where your competitors get their traffic so you can reverse-engineer their strategy.
- Funnelytics: Maps out the visual path your customers take (e.g., Ad -> Blog -> Webinar -> Sale), showing you exactly where they drop off.
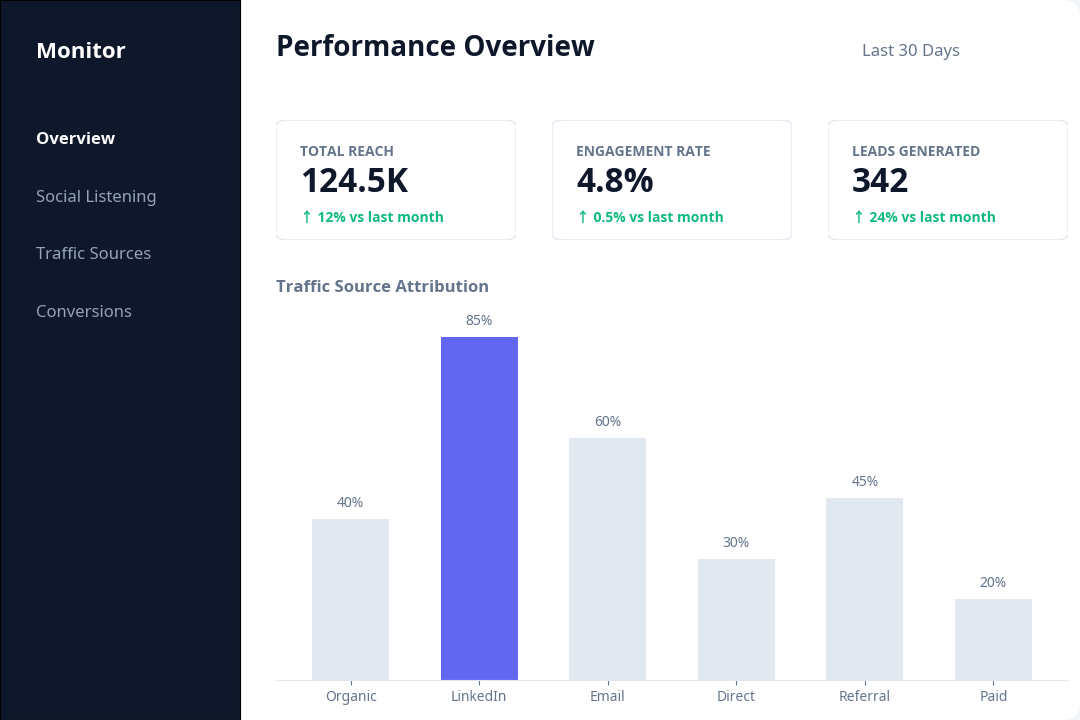
Figure: A healthy monitoring dashboard tracks Reach, Engagement, and Conversion in one view.
3. Enquiry Tracking (The Bottom Line)
Ultimately, content must lead to commerce. You must connect the dots between a blog post and a bank deposit.
- The Goal: Attribution. Knowing exactly which piece of content generated the lead.
- Strategy: Use UTM parameters on every link and ask "How did you hear about us?" on every enquiry form. If you don't track the source, you can't scale the success.
Conclusion
The goal of the Monitor Engine is not to drown in spreadsheets. It is to find the Signal in the Noise.
When you stop guessing and start measuring, you stop wasting time on content that doesn't work. You double down on what resonates. You stop shouting into the void and start having a conversation.
"What gets measured gets managed. What gets managed gets improved."
What's Next
The final step is analyse. What does the monitoring tell us. That's coming up in the next chapter.
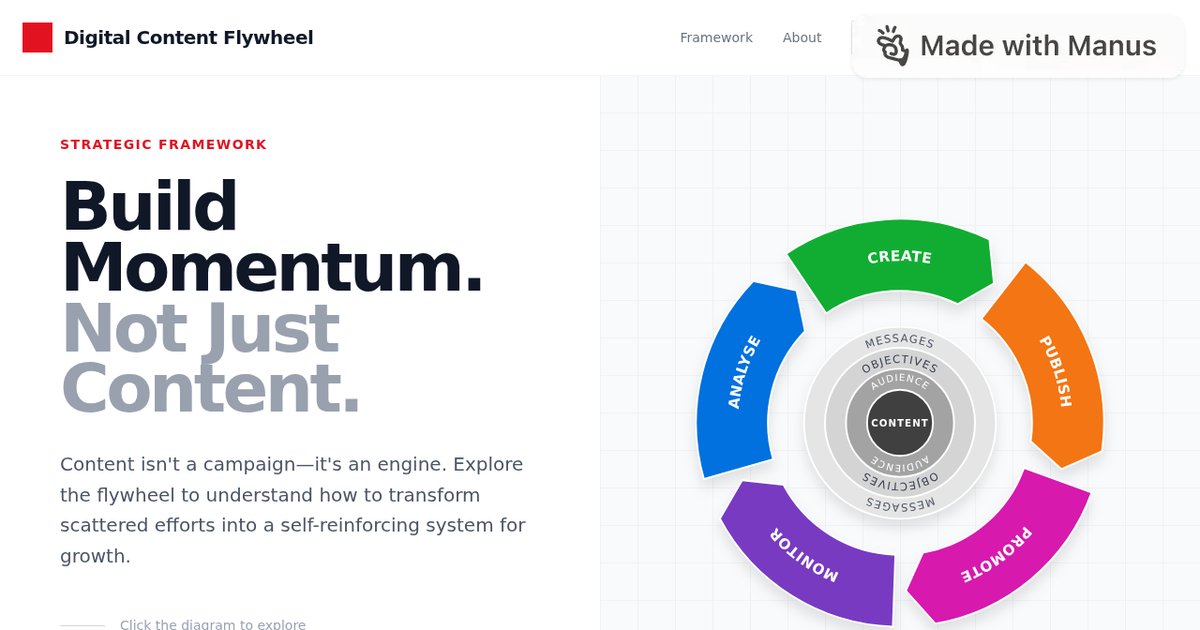
Want More?
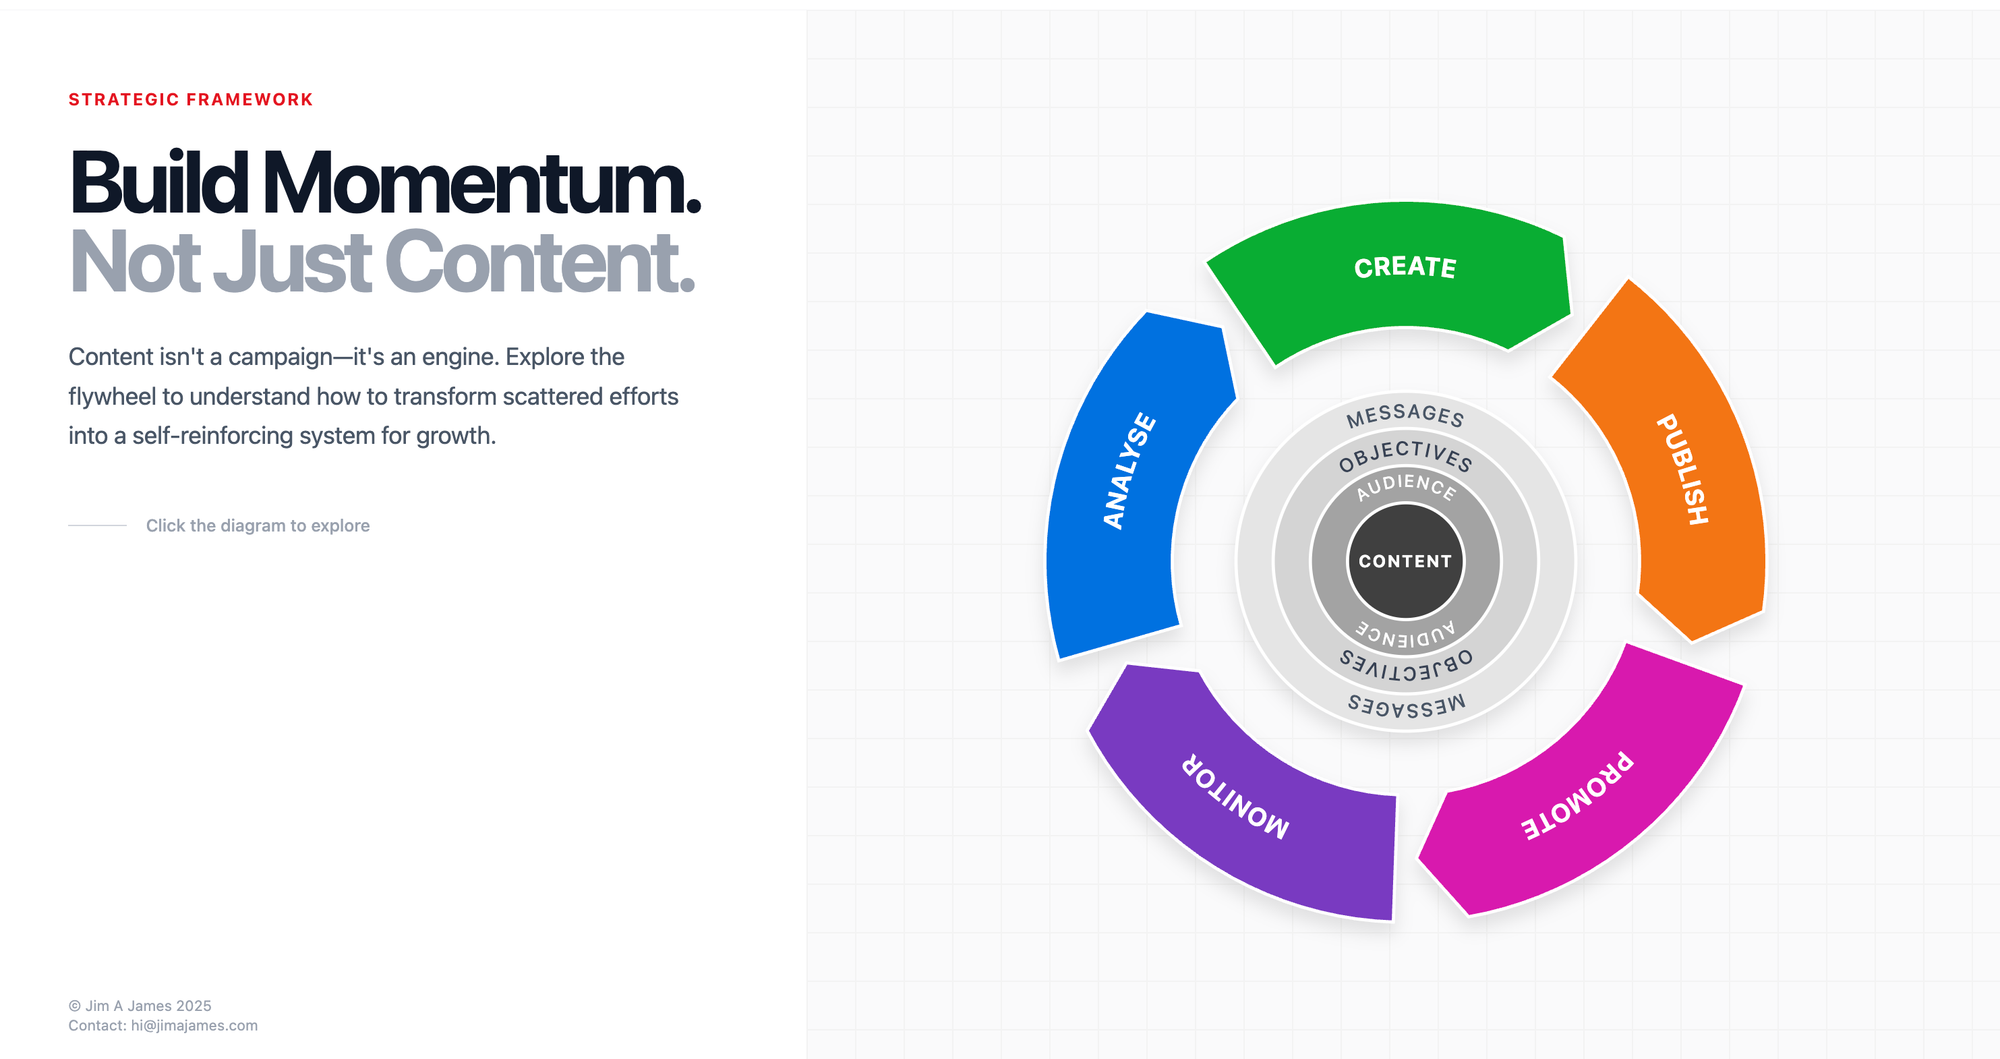
This article is part of a series of 5 which cover the Digital Content Flywheel.
You can view the interactive chart and download a workbook on the dedicated site below.